Insights
April 3, 2020
COVID-19 Monitoring Resources
In Uncategorized

April 03, 2020
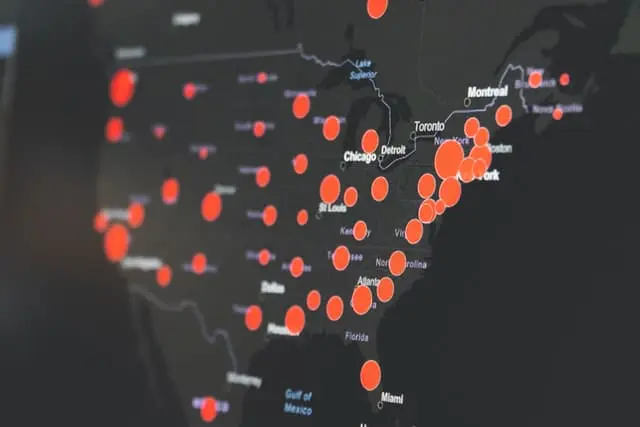
As we continue to track the COVID-19 situation and assess its impact on financial markets, we wanted to share some of the resources we’re monitoring on a daily basis. Useful data is scattered across the internet, so we look at a variety of sources to get a fuller picture of how various states and countries are handling the pandemic, particularly how case and death curves are trending.
- https://covid19.healthdata.org/projections – University of Washington model projecting cases, ICU utilization, and deaths nationally and by state; cited by Drs. Birx and Fauci in the March 31 White House briefing
- https://ourworldindata.org/coronavirus – a very large collection of useful charts
- https://www.worldometers.info/coronavirus/ – frequently updated case and death counts by country and by US state
- https://www.nytimes.com/interactive/2020/03/21/upshot/coronavirus-deaths-by-country.html – global and state death curves (free registration may be required)
- https://www.nytimes.com/interactive/2020/world/coronavirus-maps.html – global and US case maps (free registration may be required)
- http://depts.washington.edu/labmed/covid19/ – near real-time UW Virology Lab test results
- https://coronavirus.jhu.edu/map.html – Johns Hopkins global case map
We’ve also included a few historical articles that might be of interest to the budding amateur epidemiologists among us:
- https://www.nationalgeographic.com/history/2020/03/how-cities-flattened-curve-1918-spanish-flu-pandemic-coronavirus/ – case curves for the 1918 pandemic by US city (free registration may be required)
- https://www.newyorker.com/magazine/1997/09/29/the-dead-zone – beautifully written 1997 article on attempts to sequence the genome of the 1918 virus
Article written by: Darren Ritchie, CFA®, CAIA® | Portfolio Manager
Disclaimer: Please note that while Coldstream believes these sources to be reliable, we cannot guarantee their accuracy, completeness, or timeliness. Testing capacity to detect COVID cases and deaths varies greatly between regions, so case figures may not be directly comparable. Methodologies also differ, such as whether “presumptive cases” are included and how causes of death are assigned by local authorities. COVID data is frequently incomplete and figures for recent days are especially subject to revision. For these reasons, we believe moving averages and trend lines are more useful than focusing on any specific data point. CFA® and Chartered Financial Analyst® are registered trademarks owned by CFA Institute. CAIA® is a registered certification mark owned and administered by the Chartered Alternative Investment Analyst Association.
Insights Tags
Related Articles

November 25, 2019
Detlef’s Interview with Chase Jarvis

April 15, 2019
The Underwriting of a Construction Loan Through the Eyes of a Lender

March 19, 2019
The Inherent Value of Good Advice