
Insights
April 9, 2026
Turbulence: Navigating a Complex First Quarter
In Market Commentary

There is something grounding about traveling internationally during a period of market stress—ironic, perhaps, given the language barriers, unfamiliar customs, and cities where the familiar rhythms of home feel far away. My family spent spring break traveling through Hong Kong, China, and Japan, and what stood out was not disruption but continuity. Full flights, trains running on time, restaurants packed with locals and tourists alike, cities fully open for business and humming with the energy of daily life. In the meantime, markets were experiencing genuine turbulence, though the real economies we passed through, at least on the surface, had not yet felt it. That gap—between what markets are pricing and what the real economy has yet to absorb—is perhaps the most important investment question heading into the second quarter.
Q1 2026 Highlights
Geopolitics dominated the quarter.
The U.S.-Israeli strikes on Iran and the subsequent closure of the Strait of Hormuz triggered one of the largest energy supply disruptions in the history of the global oil market, reshaping the macro outlook for inflation, growth, and monetary policy simultaneously.
Equity markets declined but held up better than headlines suggested.
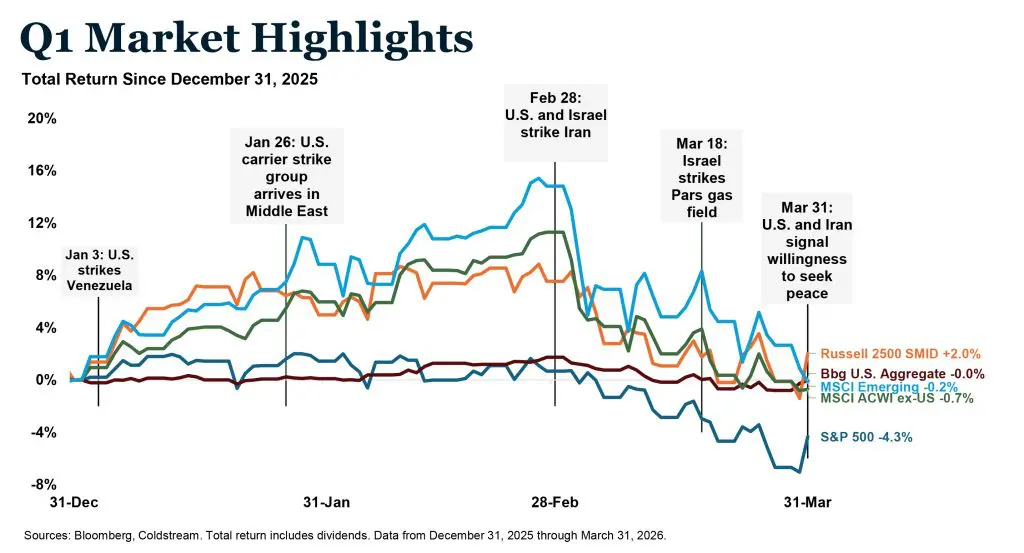
The S&P 500 fell 4.3% for the quarter, a meaningful but historically modest drawdown. Beneath the surface, dispersion was pronounced. Value stocks rose while growth sold off sharply, and more than half of individual S&P 500 stocks outperformed the Index.
Diversification provided meaningful ballast.
U.S. small and mid cap stocks were positive for the quarter despite the risk-off nature of the market. International and emerging market equities held up better than U.S. large cap. Fixed income was roughly flat, again demonstrating its stabilizing role in times of equity stress.
Tariff uncertainty added increased ambiguity.
The Supreme Court’s International Emergency Economic Powers Act (IEEPA) ruling mid-quarter introduced fresh uncertainty around U.S. trade policy at an already complicated moment. The ruling raised the question of whether a significant portion of tariff revenue collected over the prior year would need to be refunded to importers—a potential financial consideration for both businesses and the federal budget.
The real economic impact of the energy shock is still arriving.
Supply disruptions of this magnitude take time to move through the economy. The full effects on inflation, consumer spending, corporate margins, and central bank policy remain ahead of us, not behind us.
Geopolitics and the Iran Conflict: The Shock That Changed the Quarter
On February 28th, after months of unsuccessful negotiations, the United States and Israel launched coordinated airstrikes on Iran. The Q1 Market Highlights chart below illustrates how the quarter unfolded. Markets, particularly overseas, had actually risen substantially through January and into late February before the strikes triggered a sharp and sustained reversal. What followed was not a single shock but a sequence of escalating events, culminating in Israel’s strikes on Iran’s Pars gas field in mid-March, with only the final day of the quarter bringing any signal of a willingness to negotiate.
The strategic center of the conflict is the Strait of Hormuz, through which approximately 25% of global seaborne oil and 20% liquid natural gas (LNG) volumes flow daily. Iran did not need to physically blockade the strait to achieve disruption. Missile threats, drone attacks, and the withdrawal of war-risk insurance by major carriers were sufficient to effectively halt commercial tanker traffic. The International Energy Agency characterized the resulting supply shock as the largest in the history of the global oil market. Beyond oil, the conflict’s reach extended into LNG markets, fertilizer supply chains, and critical industrial materials—many of which flow through the same chokepoint and whose effects on agricultural costs and manufacturing inputs are still working their way through the global economy.
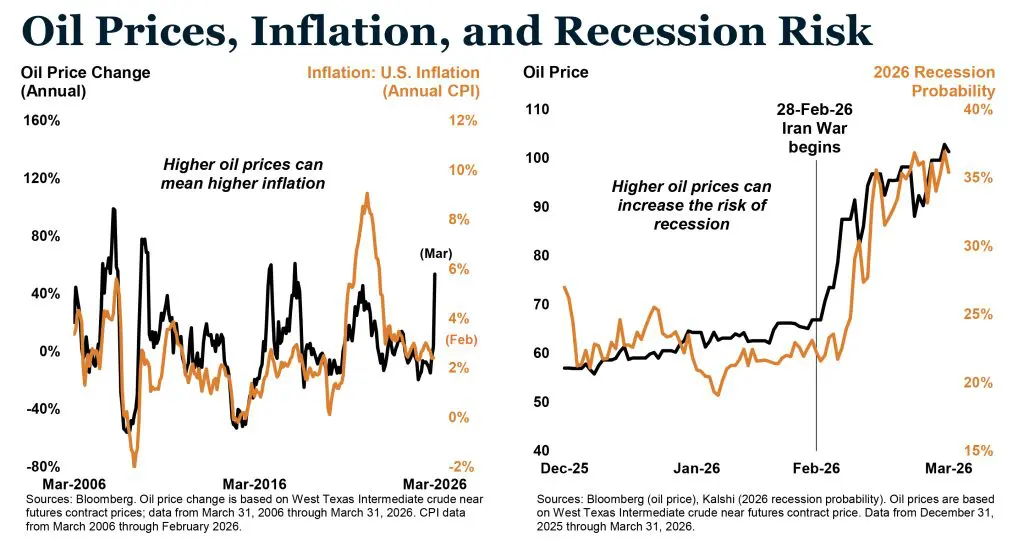
As the below Oil Prices, Inflation, and Recession Risk charts illustrates, WTI crude ended the quarter sharply higher while market-based recession probability climbed from roughly 20% to approximately 35–40%. Futures markets are pricing oil in the $70–75 range by year-end, implying an expectation of de-escalation, but as the chart makes clear, oil prices can deviate significantly from those expectations. We are watching several indicators closely as we move into the second quarter: the resumption of commercial tanker traffic, maritime insurance availability, and U.S. gasoline prices, which were approaching $4 per gallon at quarter end and carry both economic and political weight as midterm elections approach.
The market has reacted. The real economy has not yet fully absorbed the shock. That distinction and what it means for inflation, the Federal Reserve, and portfolio positioning shapes the entire backdrop for how markets and economies fare throughout the rest of 2026 and beyond.
Economy: A Resilient Foundation Meets a Significant Test
The U.S. economy entered the first quarter with reasonable momentum, steady employment, improving productivity, and modest fiscal support. That foundation has not collapsed, but it now faces two simultaneous headwinds: the energy shock from the Iran conflict, which acts as a direct tax on consumers and businesses, and continued trade policy uncertainty following the Supreme Court’s IEEPA ruling.
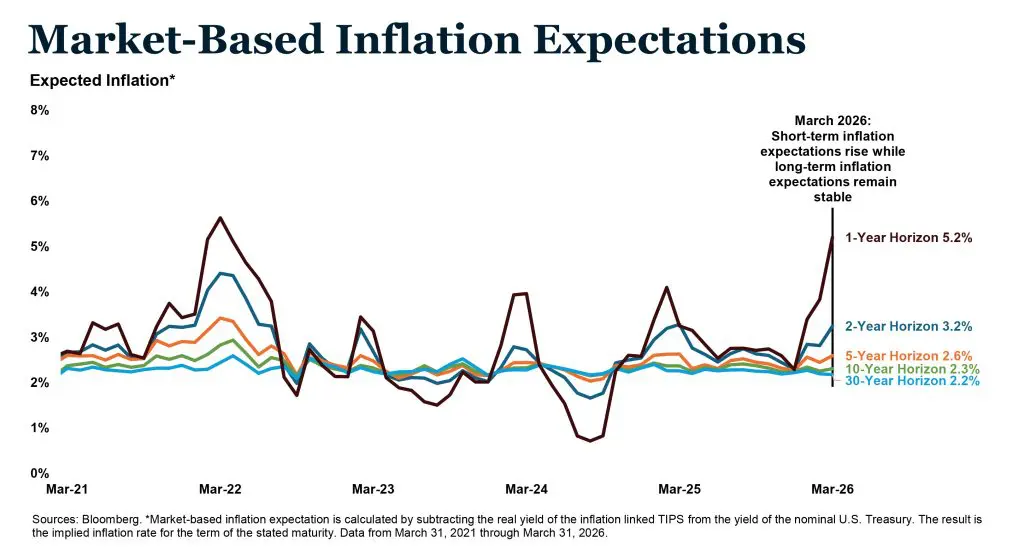
The Market-Based Inflation Expectations chart here captures the resulting tension well. Short-term inflation expectations surged to 5.2% by quarter end while long-term expectations at the 10- and 30-year horizon remained anchored near 2.2–2.3%. That divergence is meaningful. Markets are pricing a near-term disruption, not a structural inflation regime change, which is an important distinction.
Given the increased uncertainty, the Federal Reserve is expected to hold rates steady at 3.5–3.75% throughout the quarter, communicating a deliberate wait-and-see approach. Adding complexity, Fed Chair Powell’s term expires May 15th with nominated successor Kevin Warsh not yet confirmed. A leadership transition at the Fed during a period of genuine economic stress is an additional variable worth monitoring carefully.
The encouraging signal is that long-term inflation expectations have not become unanchored. If the conflict de-escalates and energy prices moderate, the disinflationary trend underway before February 28th could reassert itself. If disruptions persist, the calculus changes considerably. That binary remains the single most important economic variable heading into the second quarter.
U.S. Equities: Rotation Beneath a Modest Decline
The S&P 500 fell 4.3% in the first quarter, its worst quarter since 2022, but the headline number understates both the turbulence beneath the surface and the shelter that turbulence created for diversified investors.
The quarter began with pressure on technology and software stocks, as investors grew increasingly focused on whether artificial intelligence capital spending would translate into durable returns. Then the Iran conflict arrived in late February and reshuffled the leadership deck entirely. As the ‘Old Economy’ Sectors chart illustrates, the rotation was dramatic: Energy surged 38.2% while Financials, Technology, and Consumer Discretionary each fell roughly 9%. In all, six of eleven S&P 500 sectors finished the quarter in positive territory.
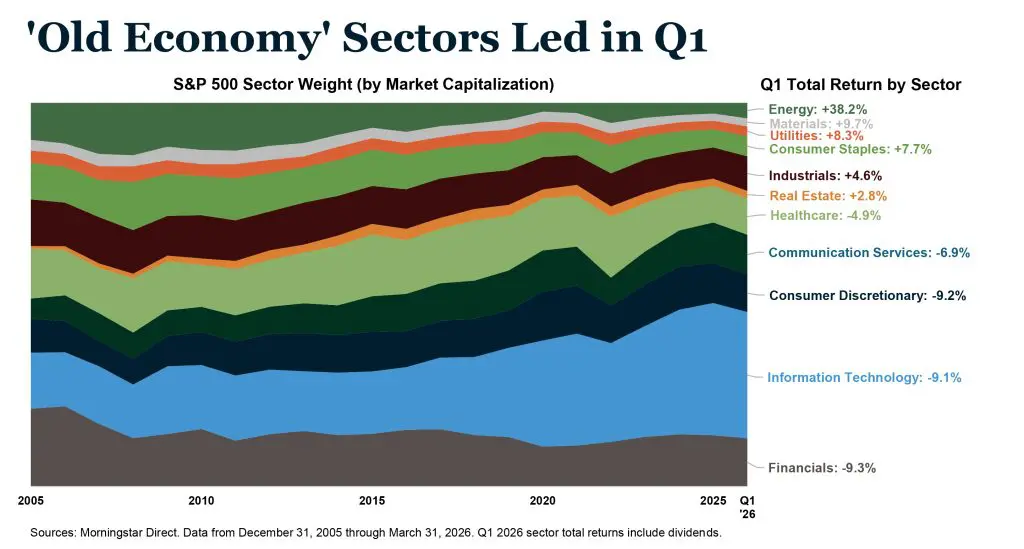
The chart also provides important longer-term context. Over the past two decades, Technology has more than doubled its weight in the S&P 500 while Energy has shrunk considerably. That concentration meant that when investors rotated toward energy and other defensive sectors, index-level damage was amplified even as many individual sectors and diversified portfolios held up considerably better than the headline suggested.
Looking ahead, we believe the environment increasingly favors diversification. Quality balance sheets, pricing power, and earnings durability matter more in a world where energy costs are rising and the economic outlook carries genuine uncertainty. The “Magnificent Seven” (Apple, Microsoft, Amazon, Alphabet, Tesla, Nvidia, Meta) fractured meaningfully during the quarter as investors began evaluating each company on its individual merits, a shift that rewards disciplined portfolio construction over a purely passive index orientation.
International Equity: Resilience When It Mattered
International equities held up notably better than U.S. stocks during the first quarter, continuing a theme that began in earnest last year and reinforcing the case for maintaining global diversification through periods of uncertainty.
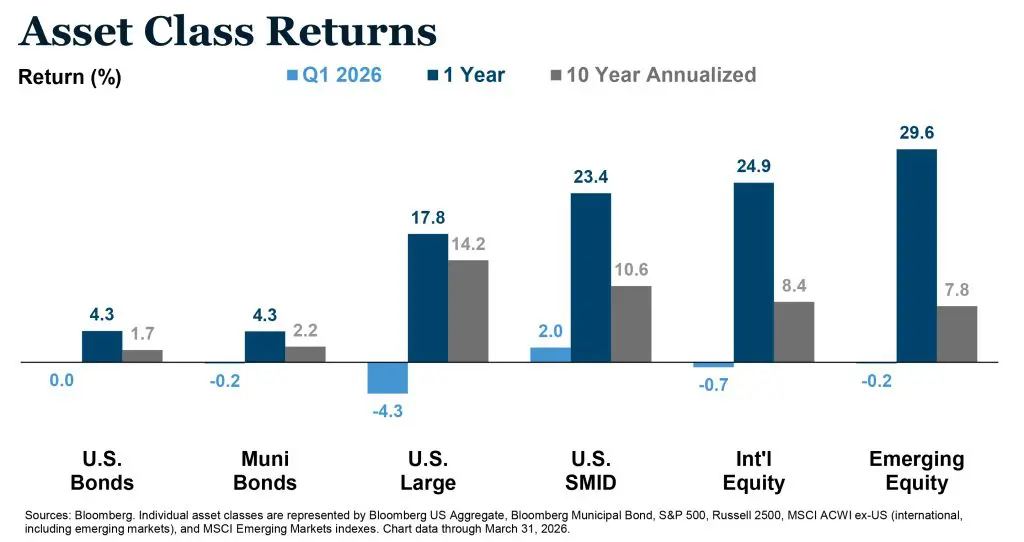
The Asset Class Returns chart below tells a compelling story. While the S&P 500 fell 4.3%, international equities declined just 0.7% and emerging markets only 0.2%, a meaningful divergence that rewarded investors who had maintained broad global exposure rather than concentrating in U.S. large cap. U.S. SMID stocks, at +2.0%, were the best performing equity category for the quarter, a further reminder that diversification within U.S. equities also added value.
Beneath the regional numbers, the picture was nuanced. Japan’s TOPIX was the best performing major equity market, supported by a weaker yen and renewed fiscal optimism. Emerging markets held up despite the energy import concerns that the Hormuz disruption created for Asia, which receives more than 80% of the oil that transits the strait. European equities faced more direct pressure from rising gas prices and geopolitical proximity to the conflict, though the structural investment case for Europe, built on fiscal expansion, defense spending, and energy independence initiatives, remains largely intact and may in fact be accelerating as the conflict reinforces the urgency of reducing external dependencies.
In last quarter’s market commentary, we noted that leadership transitions between U.S. and international markets have historically occurred in long, multi-year cycles rather than brief episodes. One quarter does not confirm a trend, but two consecutive periods of international outperformance, combined with still-attractive relative valuations outside the U.S., continues to support maintaining diversified global equity exposure as a strategic foundation rather than a tactical trade.
Fixed Income: Stability When Portfolios Needed It Most
Fixed income delivered on its most fundamental promise in the first quarter. Not by generating strong returns, but by providing stability when equity markets were under stress. The Bloomberg U.S. Aggregate returned essentially flat for the quarter, and municipal bonds were similarly unchanged. In an environment where U.S. large cap stocks fell 4.3%, that stability was meaningful.
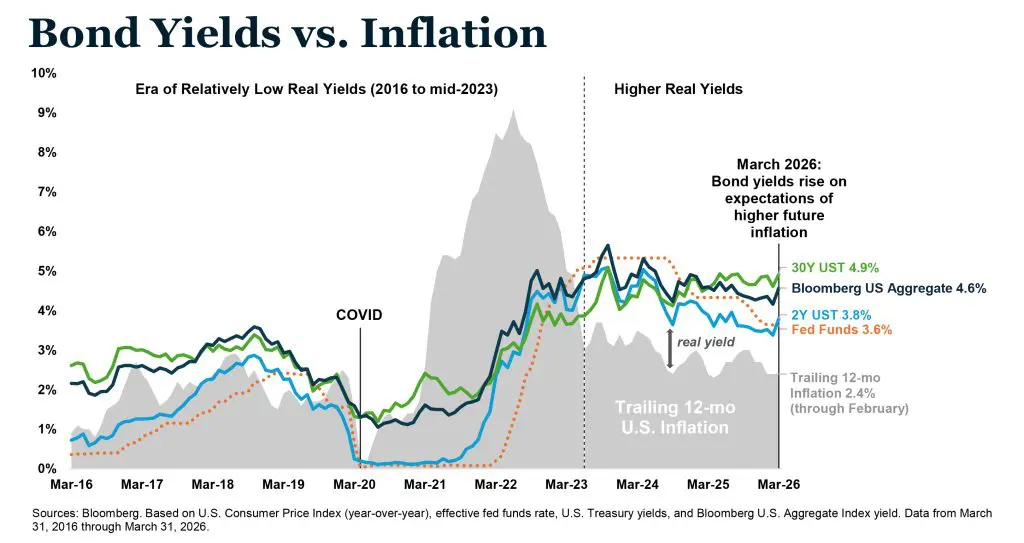
The Bond Yields vs. Inflation chart helps explain both the muted return and the encouraging longer-term picture. Bond yields rose approximately 0.4% in March as inflation expectations climbed following the Iran strikes. Higher yields mean lower prices, which offset the income bonds generated during the quarter. But the same chart illustrates an important structural positive: since mid-2023, bond yields have exceeded inflation by a meaningfully wider margin than in the prior decade. Investors are being paid real income again, a significant change from the extended period of near-zero real yields that persisted through much of the 2010s.
The Market-Based Inflation Expectations chart below adds further context. While short-term inflation expectations rose sharply to 5.2%, longer-term expectations remained anchored near 2.2–2.3%. For fixed income investors, that long-term stability is critical. It suggests that bond markets are not pricing a 1970s-style inflation regime, but rather a near-term energy-driven disruption. If that view proves correct, the current yield environment represents an attractive entry point rather than a risk to avoid.
We continue to favor high-quality fixed income—investment-grade corporates, agency securities, and municipal bonds—where yields remain attractive and credit fundamentals are sound. High yield spreads bear watching as the economic uncertainty builds, and we do not believe this is a moment to reach for incremental yield by extending credit risk. Income remains the most reliable driver of bond returns in this environment, and the asset class continues to play a central role in portfolio construction as both a source of return and a buffer against equity volatility.
Conclusion: Danger and Opportunity
There is a concept in the Chinese language—危机 (wēijī) —often translated as “crisis,” but understood to carry within it two distinct ideas: danger and opportunity. Traveling through Hong Kong, China, and Japan and watching ordinary life continue at an ordinary pace while markets were absorbing an extraordinary shock, that duality felt particularly present. The danger is real. So is the opportunity for investors with the patience and discipline to look through near-term turbulence toward what lies on the other side.
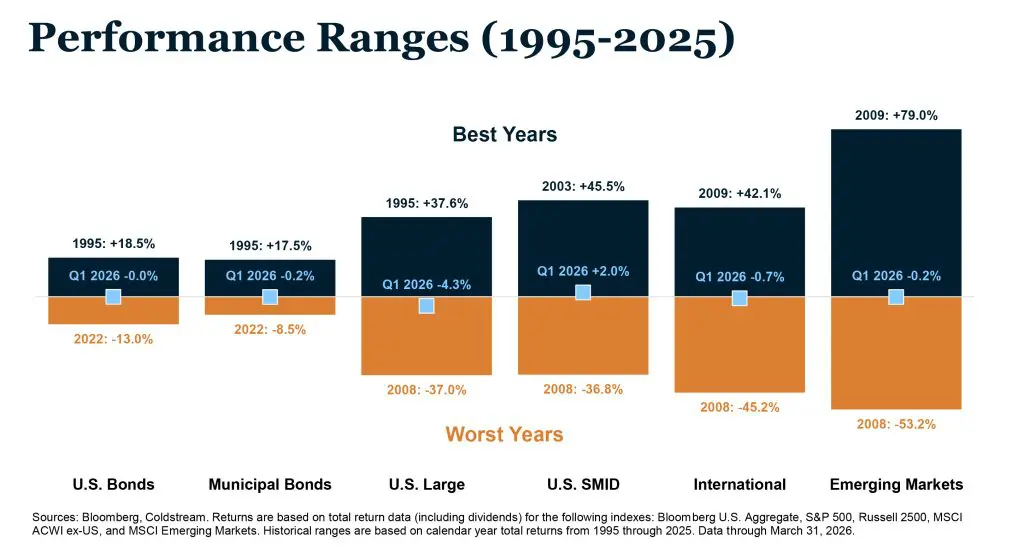
Perspective helps. As the Performance Ranges chart illustrates, Q1 returns across every major asset class landed near the center of their historical annual ranges. The quarter felt turbulent, but by historical standards, it was not.
That context does not minimize what lies ahead. The Iran conflict represents a genuine shift in the macro landscape, and the full effects on inflation, consumer spending, and corporate margins remain ahead of us.
What we are confident in is the value of preparation over prediction. Portfolios built with diversification across regions, asset classes, and sources of return navigated the quarter with considerably less damage than those concentrated in the areas that had led for the prior two years. That is not an accident. It is the intended result of a disciplined investment philosophy and portfolio construction approach. Maintaining that discipline through uncertainty, rather than waiting for clarity that rarely arrives on schedule, is what positions investors to capture the opportunity that inevitably accompanies every crisis.
* Information is current as of 3/31/2026, drawn from third-party sources believed to be reliable but not guaranteed as to accuracy, timeliness or completeness. The views and opinions expressed are those of the author and are subject to change at any time based on market or other conditions. None of the information provided constitutes an opinion or a recommendation or a solicitation of an offer to buy or sell any particular security. Any forward-looking statements are based on assumptions as of the date indicated and involve risks and uncertainties that may cause actual results to differ materially. Coldstream analyses are not intended to provide, and should not be construed to constitute, complete accounting, insurance, investment, legal, or tax advice. The investment strategies and securities shown may not be suitable to you. Past performance is no guarantee of future returns. Questions and comments may be directed to your advisor.
* The CFA Institute owns the certification marks CFA® and Chartered Financial Analyst®. CAIA® is a registered certification mark owned and administered by the Chartered Alternative Investment Analyst Association® in the United States.
Related Articles
April 13, 2026
Watch Coldstream’s MarketCast for Second Quarter 2026


January 29, 2026
Artificial Intelligence: Boom or Bubble?


January 13, 2026
Perspective After a Volatile Year: What 2025 Reinforced About Diversification and Discipline